RADIO ASTRONOMY EXPERIMENTS
Our experiments
-
ATMOSPHERE project with RAL_Atm (below)
-
Experiment with RAL10: Moon microwave (pdf)
-
VHF Meteor Scatter: bistatic radar with GRAVES (pdf)
-
Experiment at 11.2 GHz with SPIDER230: Taurus A (below)
-
Experiment at 11.2 GHz with SPIDER230: Cassiopea A (below)
Contributions from our friends
-
Experiment with RAL10KIT by Giancarlo Madiai (below)
-
Breve nota per la realizzazione di un piccolo radiotelescopio amatoriale – by Riccardo Gatti (pdf)
-
Useful information for those who wish to start with amateur radio astronomy
(Jean Marie Polard – F5VLB) – French Version – English Version -
Projet ART – Awesome Radio Telescope (Ruben Barbosa) (pdf)
Progetto ATMOSFERA: sperimentazioni e misure
RadioAstroLab ha recentemente avviato un progetto di ricerca che riguarda lo studio dell’atmosfera, in particolare l’analisi delle caratteristiche della troposfera, lo strato vicino al suolo dove si localizzano i fenomeni meteorologici.
La possibilità di utilizzare i nostri radiometri a microonde (banda 10-12 GHz) in applicazioni di remote-sensing del territorio e dell’atmosfera è molto interessante e apre nuove prospettive di ricerca, appetibili anche per lo sperimentatore dilettante. Lo strumento che presentiamo, RAL_Atm, è un prototipo di radiometro a microonde (MW) e all’infrarosso (IR) progettato per misurare l’emissione termica degli strati dell’atmosfera vicini al suolo, per valutare la temperatura di brillanza dell’atmosfera e la sua trasparenza nella banda delle microonde (11.2 GHz), per verificare le proprietà di assorbimento e di diffusione dell’aria in modo da ottenere informazioni sulle caratteristiche del mezzo e dati utili a fini meteorologici e di tutela dell’ambiente. La possibilità di misurare l’opacità dell’atmosfera nella
Anche se l’atmosfera terrestre è relativamente trasparente alle onde radio, la sua influenza non è trascurabile. La presenza dell’atmosfera incrementa il rumore termico captato dalle antenne e, soprattutto alle frequenze radio più elevate (microonde), si verificano fenomeni di assorbimento e di diffusione dovuti alle molecole di gas presenti nell’aria. I processi fondamentali che regolano la propagazione delle onde radio attraverso l’atmosfera sono l’assorbimento, l’emissione e la diffusione. La radiazione dell’atmosfera, misurata da un radiometro a livello del suolo, è espressa in termini di temperatura di brillanza, definita come la temperatura fisica di un corpo nero (ideale) che emette la stessa potenza osservata dallo scenario. Per le temperature che caratterizzano l’atmosfera e per frequenze inferiori a 200 GHz la legge di Planck è ben approssimata con la relazione di Rayleigh-Jeans che stabilisce una proporzionalità fra la temperatura di brillanza dell’oggetto osservato e la sua temperatura fisica. Orientando l’antenna di un radiometro a microonde sullo zenith locale è possibile misurare l’opacità della stessa applicando la legge del trasferimento radiativo, dove le sorgenti radiative sono la temperatura di brillanza del fondo cosmico a microonde (circa 3 K) e i contributi di brillanza dei vari strati atmosferici lungo il cammino di vista dello strumento, pesati dalla funzione coefficiente di assorbimento volumetrico dell’aria. L’opacità (è una misura della trasparenza dell’aria), principale grandezza di interesse per la nostra sperimentazione, si calcola ipotizzando alcune ragionevoli approssimazioni sulla stratificazione dell’atmosfera e sulla sua temperatura media. L’opacità atmosferica, opportunamente elaborata, consente interessanti valutazioni sulla qualità dell’aria che respiriamo, in particolare sulla presenza di inquinanti nelle zone urbane.
Correlando le misure radiometriche a microonde con quelle radiometriche all’infrarosso (sensibili al contenuto di vapore acqueo, quindi alle formazioni nuvolose che transitano nel campo di vista dello strumento) e con le misure di temperatura dell’aria e di umidità a livello del suolo, è possibile ricavare una grande quantità di dati interessanti anche dal punto di vista meteorologico che, opportunamente elaborati, consentono di azzardare previsioni sulle precipitazioni. Questo è un terreno fertile per la sperimentazione, che coinvolge raffinate tecniche di post-elaborazione dei dati: forniremo dettagli sugli sviluppi di questa interessante sperimentazione. La Fig. 4 mostra le informazioni che si ricavano elaborando i dati acquisiti dallo strumento.
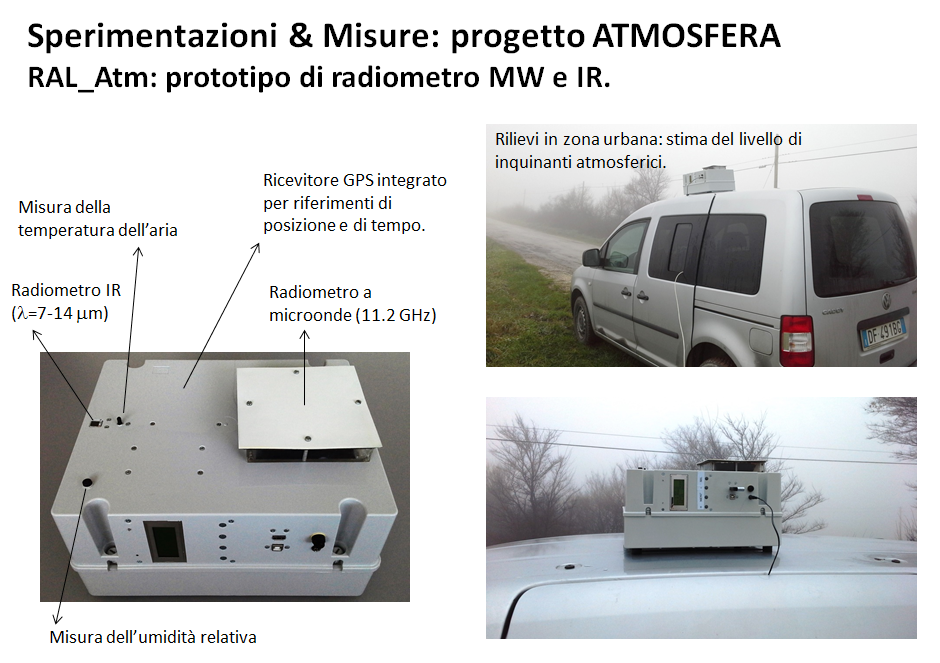
Il prototipo RAL_Atm è stato costruito per “vedere” il cielo dal tetto di un automezzo adibito a laboratorio mobile (Fig. 1). E’ indispensabile scegliere un luogo per la misura sgombro da alberi, costruzioni o strutture che, intercettate dalle antenne dei radiometri (anche dai lobi laterali), introducono errori nelle misure aggiungendo componenti alla temperatura di brillanza estranee alla radiazione atmosferica. E’ molto importante posizionare lo strumento in modo che i lobi laterali delle antenne non ricevano contributi di rumore significativi dal terreno o da strutture adiacenti, caratterizzate da una temperatura di brillanza molto più elevata rispetto a quella del cielo “freddo” (Fig. 3): l’installazione ideale è quella che prevede il posizionamento sul tetto di un alto edificio, con il campo di vista libero da ostacoli.
Lo strumento comprende i seguenti moduli:
-
Radiometro a microonde (MW) con elevata stabilità e risoluzione (tipo Dicke-Switch), operante alla frequenza di 11.2 GHz, caratterizzato da una banda passante di circa 1 GHz, equipaggiato con un’antenna horn tronco-piramidale con guadagno di circa 19 dB e ampiezza del fascio di ricezione di 17.6 gradi (Fig. 2).
-
Radiometro all’infrarosso (IR) operante nell’intervallo di lunghezze d’onda l=7÷14 mm, equipaggiato con un’antenna caratterizzata da un’ampiezza del fascio di ricezione (simmetrico) di circa 7 gradi.
-
Ricevitore GPS che fornisce la posizione dello strumento e le informazioni di tempo universale.
-
Misura della temperatura dell’aria e dell’umidità relativa.
-
Elettronica di controllo e di gestione dei vari moduli.
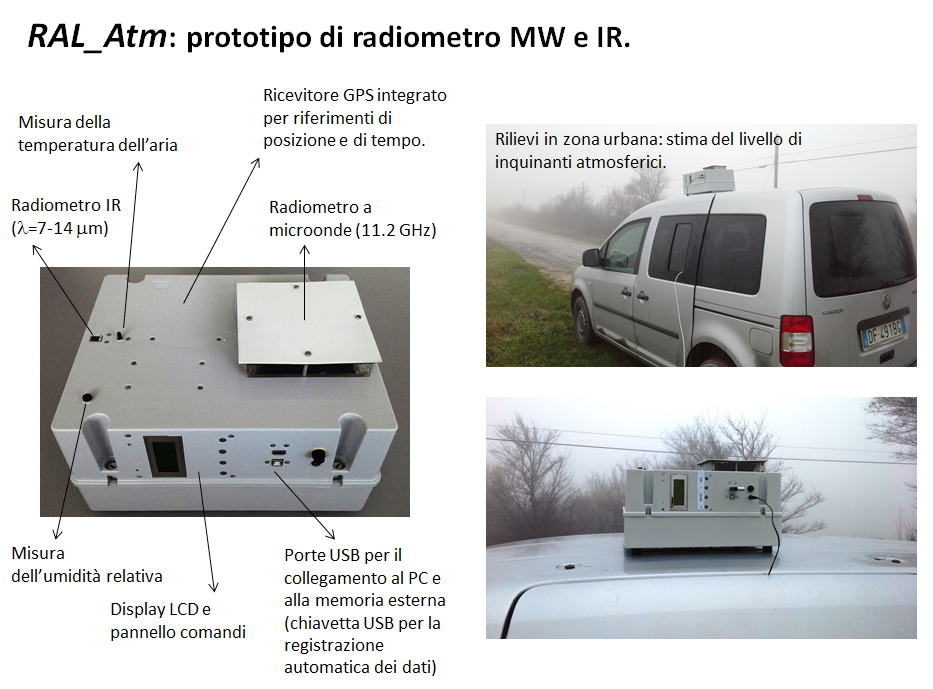
Fig. 1: Prototipo del radiometro MW (11.2 GHz) e IR (l=7-14 mm) sviluppato per lo studio delle caratteristiche della troposfera. Lo strumento è posizionato sul tetto di un’autovettura con le antenne orientate sullo zenith locale. Sono misurate la temperatura dell’aria, l’umidità relativa, l’intensità del segnale radio a 11.2 GHz e l’intensità del segnale IR. Un ricevitore GPS integrato fornisce i riferimenti di posizione e di tempo ed è possibile registrare i dati tramite collegamento al PC (porta USB), oppure salvando le misure in formato testo su una comune chiavetta USB di memoria esterna, ad intervalli di tempo programmabili.
Lo strumento è equipaggiato con un display LCD che visualizza lo stato del sistema, una tastiera per l’impostazione dei parametri operativi, una porta USB per il collegamento con il PC e una seconda porta USB per l’inserimento di una chiavetta di memoria esterna che registra i dati acquisiti. Tale opzione è molto utile durante le sessioni di misura “sul campo” quando non è disponibile o non è pratico l’uso del PC: i dati salvati in formato testo saranno successivamente scaricati e utilizzati per le necessarie elaborazioni. E’ stato sviluppato un software dedicato, DataRAL_ATM, per il controllo dello strumento, l’acquisizione, la visualizzazione grafica e la registrazione delle misure tramite PC.
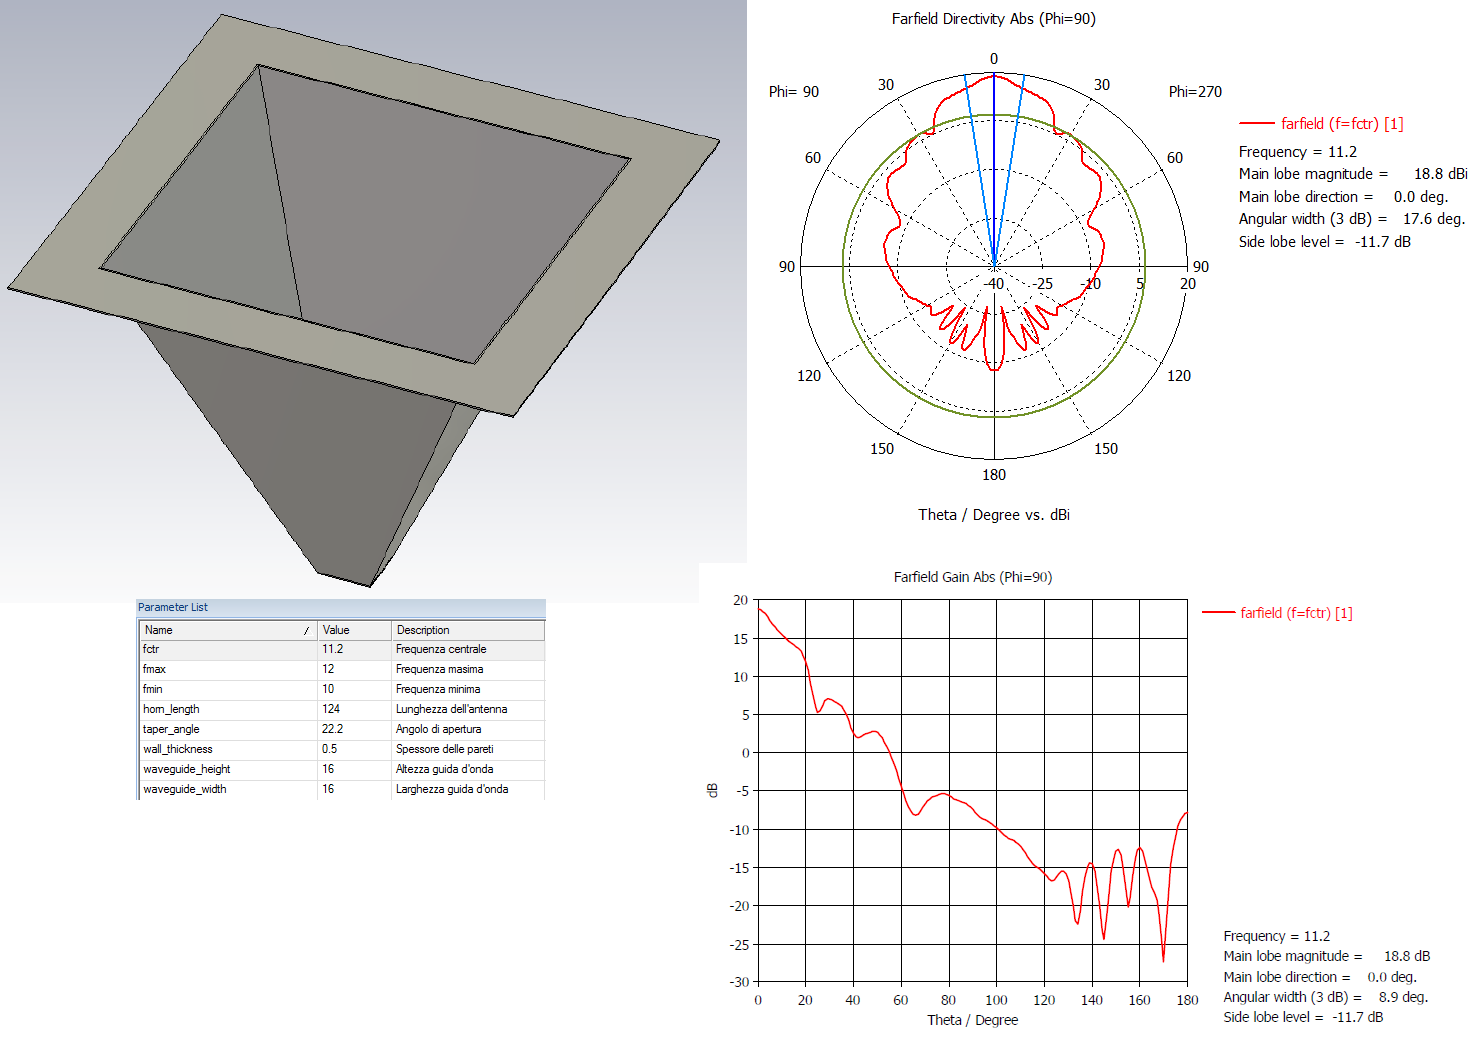
Fig. 2: Antenna horn piramidale costruita per il radiometro a microonde 11.2 GHz: sono mostrate le dimensioni e le prestazioni simulate al calcolatore.
La Fig. 3 mostra la risposta del radiometro a microonde quando l’antenna è orientata verso il cielo (sereno e asciutto, libero da formazioni nuvolose) e quando “vede” il terreno: il guadagno di post-rivelazione del sistema e l’offset che fissa il livello della linea di base radiometrica sono stati impostati in modo da sfruttare tutta la dinamica di misura dello strumento.
La Fig. 4 visualizza i dati ottenuti da una sessione di misura: ulteriori e più raffinate elaborazioni saranno necessarie per “estrarre” le informazioni richieste per ogni specifico argomento di studio. Queste misure, pianificate per un periodo sufficientemente lungo e abbinate ad altre informazioni meteorologiche, forniscono un aiuto alla corretta elaborazione delle previsioni sulle precipitazioni.
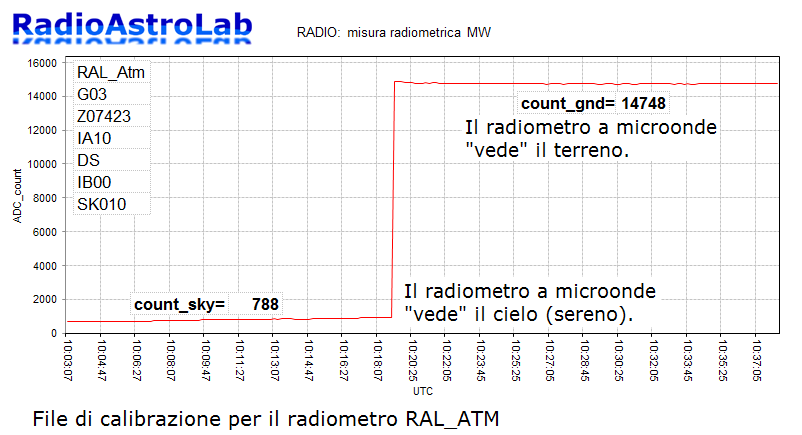
Fig. 3: Risposta del radiometro a microonde quando l’antenna dello strumento è orientata verso il cielo (atmosfera chiara e asciutta) e verso il terreno.
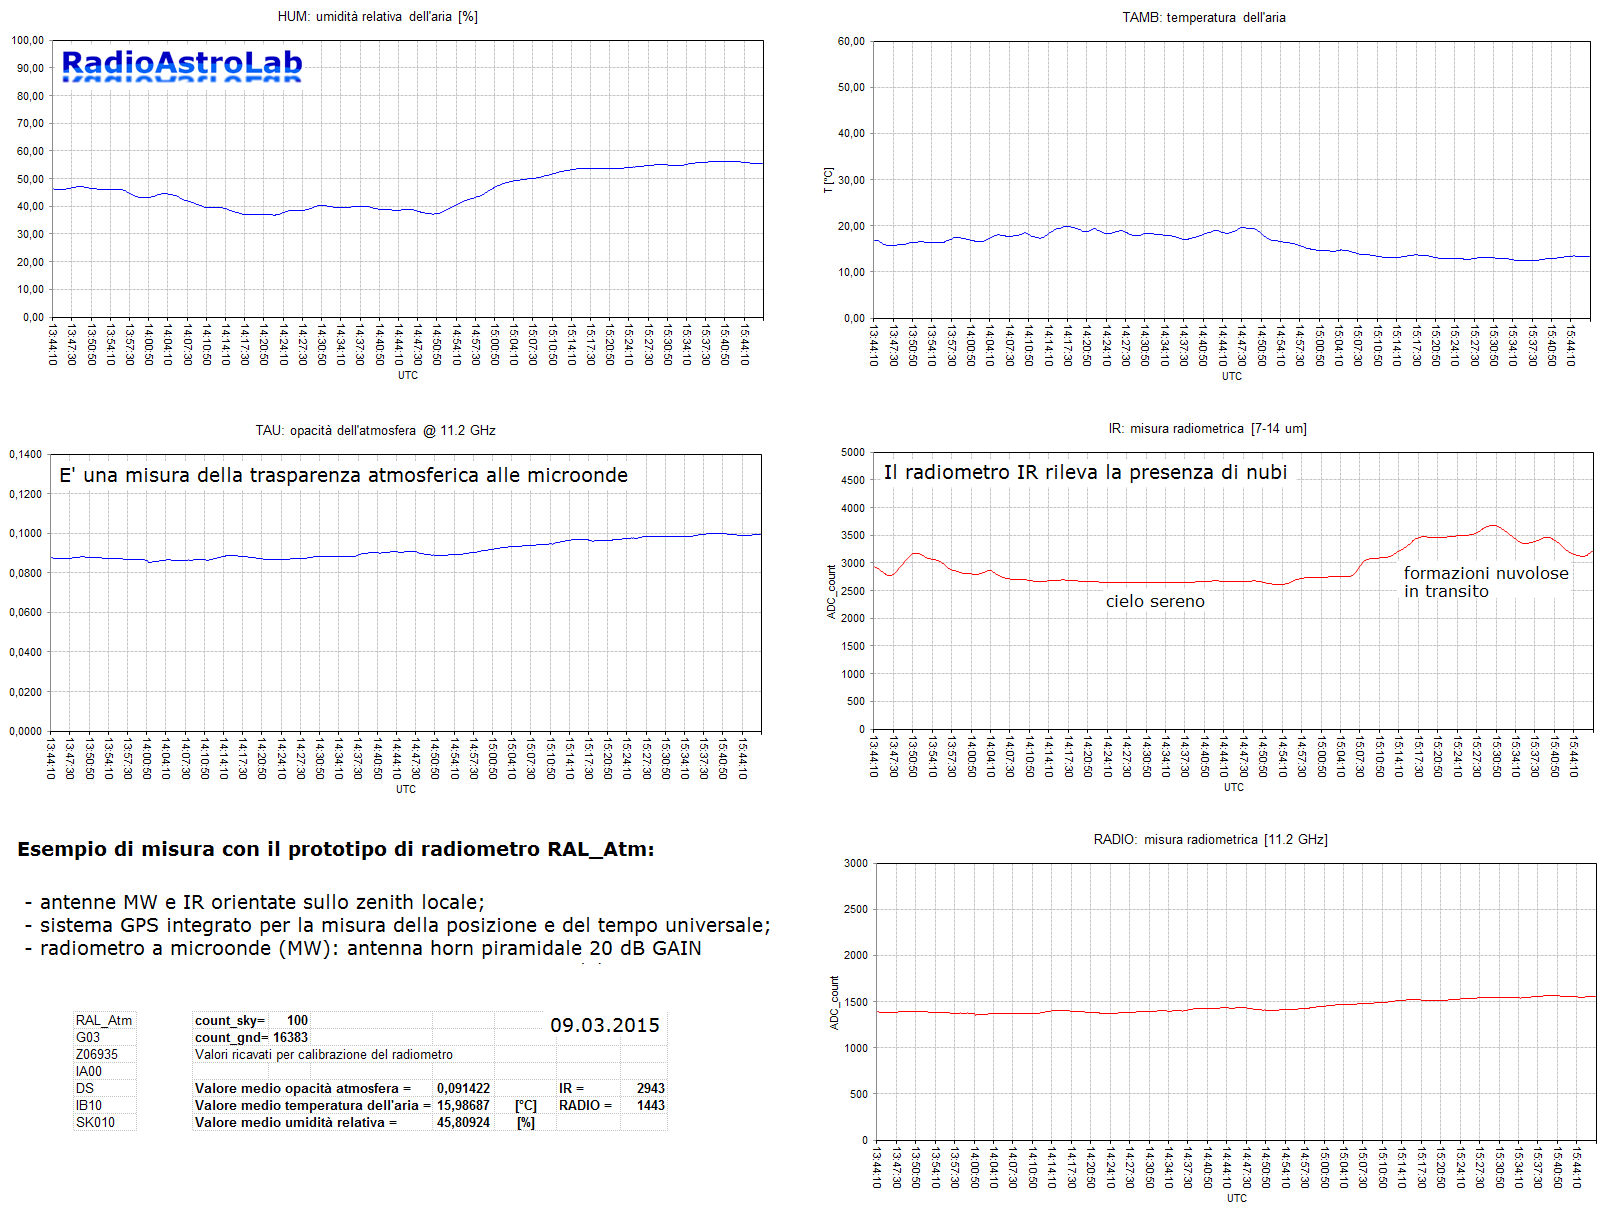
Fig. 4: Registrazioni ottenute con RAL_Atm durante una sessione di prova. Lo strumento ha registrato, ogni 10 secondi, l’andamento della temperatura dell’aria al suolo (grafico in alto a destra), l’andamento dell’umidità relativa (in alto a sinistra), l’opacità dell’atmosfera a 11.2 GHz, i valori radiometrici IR e a microonde. Si nota come la risposta del radiometro IR sia utile per confermare la presenza di formazioni nuvolose che transitano davanti al campo di vista del radiometro. Le registrazioni mostrano anche una ridotta sensibilità del radiometro a 11.2 GHz alle nubi. Tutte e misure sono state integrate con una costante di tempo dell’ordine di 40 secondi.
Experiments at 11.2 GHz with SPIDER230: The transit of Taurus A
This article describes an experiment carried out with the radio telescope SPIDER230: the registration of the radio source Taurus A (M1) transit. The results underline the performance of the instrument and lend themselves to some interesting observations on observational radio astronomy techniques.

The experiment was conducted by Dr. Filippo Bradaschia, CEO of PrimaluceLab, RadioAstroLab partner in the construction of the SPIDER230 radio telescope that we thank for his cooperation. The receiving station, installed at Polo Tecnologico of Pordenone, includes the 11.2 GHz RAL10PL Total-Power receiver specially made by RadioAstroLab for SPIDER230 and the antenna system (circular 2.3 meters diameter parabolic reflector) with equatorial mount, motorization and dome of protection made by PrimaluceLab. The instrument is completely controlled via an Ethernet line by RadioUniverse software.
Specified design criteria adopted for the RAL10PL receiver, for the antenna and for the pointing system, the RadioUniverse software for data acquisition and data processing, guarantee to SPIDER230 an high sensitivity and stability required for radio astronomy observations. We have repeatedly underlined how the sky observation in the frequency band close to 10 GHz offers several advantages:
- Reduced sensibility to external radio interferences;
- Possibility to use antennas of acceptable dimensions;
- Higher resolution capabilities related to higher radio frequencies.
These benefits allow you to install a radio telescope also in the “home garden”, however in an urban environment without too many penalties related to interferences. In any case, it is always advisable to check the suitability of the site for installation. The main disadvantages are related to the reduced number of radio sources observed with amateur or semi-professional radio telescopes.
Objects observed by SPIDER230 (at 11.2 Ghz frequency) are:
- SUN: flux of about 3 milion Jansky [1 Jy = 10-26 W/(m2 ∙ Hz)]
- MOON: flux of about 30000 Jansky
- CASSIOPEA A: flux of about 423 Jansky
- M17: flux of about 550 Jansky
- TAURUS A (M1): flux of about 506 Jansky
- ORION A (M42): flux of about 480 Jansky
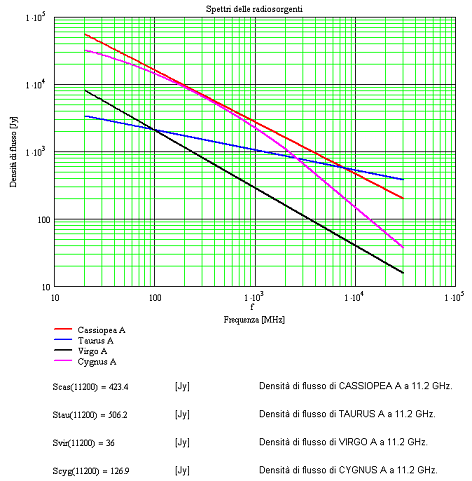
Band radio specters of the main radio sources accessible by SPIDER230.
It’s easy to note that the Moon is 100 times fainter than the Sun and Cassiopea A is 50 times weaker than the Moon. Due to the intensity of the Sun, the observation of our star with SPIDER230 requires the setting of the minimum amplification factor for the receiver and the insertion of a 22 dB attenuator along the coaxial line. The transits of the Moon are easily recorded by setting medium-low amplification factors (without attenuator), while the other items are more difficult to record. The need to verify the instrument limit performance, encouraged by the excellent sensitivity and stability measurements found for the Moon, has brought Dr. Filippo Bradaschia to schedule the data recording using the transit technique with RadioUniverse control software.
During RAL10PL receiver’s design, some simulations were carried out to verify, at least theoretically, the suitability of the system as a radio telescope. We remember that the instrument is a Total- Power radiometer running at a 11.2 Ghz frequency with high sensitivity and stability. The last feature is particularly important for a radio astronomy receiver: environment temperature changes cause small variations in the gain of the receiving chain that make it very difficult to measure, causing drifts and fluctuations in data recording. The problem is most evident when the radio source to be observed is weak and the setted amplification factor is greater. The issue is resolved by adopting appropriate design criteria and thermo-stabilizing the receiver electronic circuits. Remain the daily temperature that affect the RAL10_LNB external unit, installed on the antenna: in this case it is quite easy to characterize the behavior from the thermal point of view and adopt appropriate procedures for compensation.
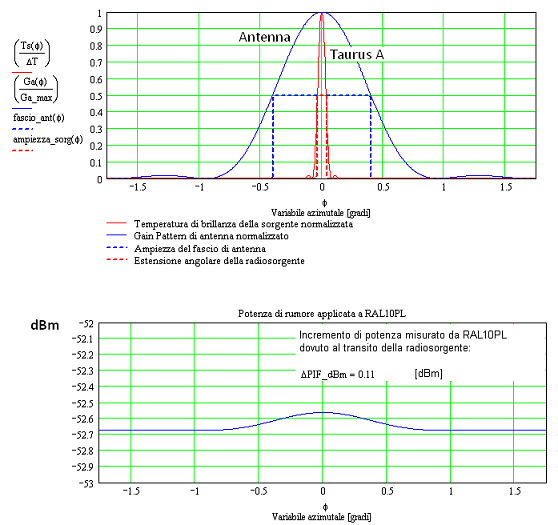
The Taurus A emission profile looks very “diluted” by the significant difference between the amplitude of the beam receiving antenna and the angular extent of the source (top chart). The chart below shows the signal power estimated increase, seen by RAL10PL receiver, due to the transit of radio source.
The image above show the results of simulations planned to investigate the possibility of receiving Taurus A with SPIDER230. The simulations are theoretical and consider an ideal behavior of the receiving system, perfectly thermally stabilized. The response of the radio telescope was calculated by setting the parameters of the receiver that will be actually used in the experiment. The antenna reception diagram and the radio source emissive one have been approximated as a uniformly illuminated circular apertures, simplifying the assessment of the spacial “filtering” effects that the antenna does on the true radio source profile. These simulations, while being very simplified, have the advantage to highlight the performance of the radio telescope. The Taurus A flux at a 11.2 Ghz frequency is about 506 Jy.
Calculations show that the variation in the antenna noise temperature due to the radio source transit is about 0.86 K and that the variation in receiver measured signal power is about 0.11 dB.
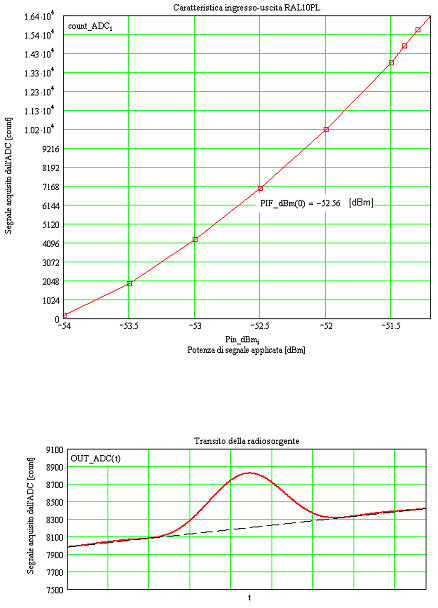
RAL10PL receiver input-output characteristic (determined in laboratory) and SPIDER230 theoretical response of Taurus A transit.
The Taurus A transit simulation is shown in figure above: is also represented in the drift of the base line radiometric that this will cause the extent “on the field”.
We verify the correspondence of the theoretical simulation with experimental data.
The transit technique used for measurement consists of identify the object for which you want to record the radio emission, point the telescope in the sky area in which the object will move in the near future (eg 30 minutes later) and stop the telescope in that position. Because of the apparent sky rotation (caused by the rotation of Earth), the object will move towards the area of sky pointed by the antenna, will be intercepted by the receive beam and will pass through.
On February 24th 2014, PrimaLuce Lab technicians have pointed the SPIDER230 antenna to Taurus A (the M1 nebula in Taurus constellation that emits synchrotron radiation caused by electrons in fast spiral motion around magnetic field lines generated by the pulsar inside) recording a first 15 degrees transit. Plotting the intensity data obtained on the sky map they have verified that this increase occurred precisely at the theoretical position of Taurus A.
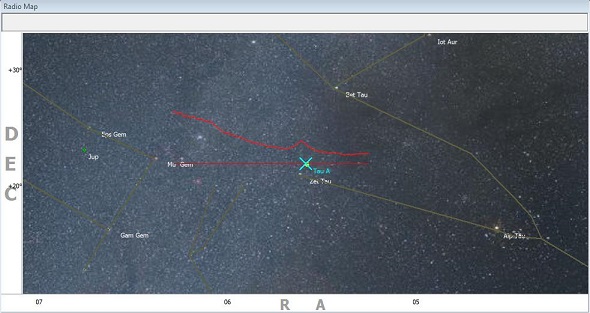
Verifying the first Taurus A transit with the RadioUniverse software.

Taurus A transits validation performed with RadioUniverse software.
To validate this registration, on March 9th 2014, 5 consecutive transits of the same area of the sky have been performed, this time 4 degrees each. SPIDER230 allows you to automatically record consecutive transits. RadioUniverse records, for each transit, a CSV file with 4 columns: each row is a record and contains date, Right Ascension, Declination and radio signal of the recorded point. So the different results obtained can be processed, for example by averaging the values to reduce random noise, increasing the visibility of the radio source. In the picture 6 we see the result of the processing of the 5 transits: the average curve is highlighted by red thick.
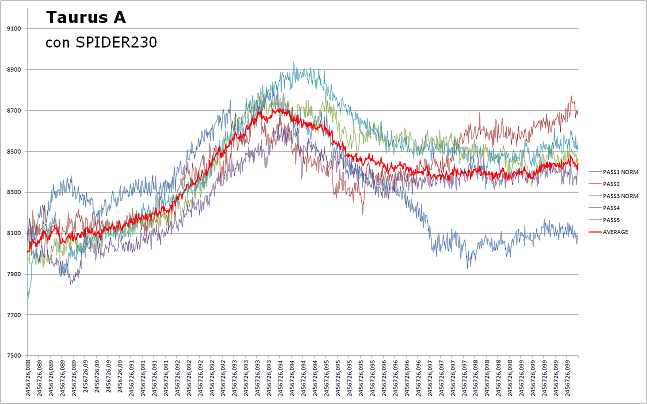
Taurus A (M1) radio source transits.
The “average” curve clearly shows the Taurus A transit which was also confirmed by the analysis of the Institute of radio astronomy of Bologna (IRA). The experimental results verify, taking into account the approximations related to the simulation, the theoretical recording, see the figure above.
Experiments at 11.2 GHz with SPIDER230: The transit of Cassiopeia A
We continue the description of the experiments realized with the radiotelescope SPIDER230 illustrating the recording of the transit of Cassiopeia A, a supernova remnant among the most interesting objects for radio astronomy, the brightest extrasolar radio source of the sky in the microwave band.
In the Visible, Cassiopeia A is very weak, since its radiation is absorbed by interstellar dust in the plane of the Milky Way. This radio source was identified in 1947 (one of the first recorded by a radio telescope) and its optical counterpart was discovered in 1950. It is thought that the supernova that gave rise to Cassiopeia A exploded 11,000 years ago and that the light of the explosion reached Earth about 300 years ago. There is no news of a sighting of this supernova, but it is possible that the star of the sixth magnitude 3 Cassiopeiae, John Flamsteed cataloged by August 16, 1680, was just Cassiopeia A.
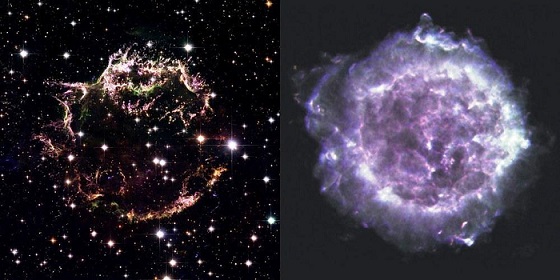
Evocative images of Cassiopeia A in the visible (left) and in the radio band (right). The image was taken in visible light by the Hubble Space Telescope (NASA, ESA and the Hubble Heritage STScI/AURA-ESA/Hubble Collaboration. Acknowledgement: Robert A. Fesen-Dartmouth College, USA and James Long-ESA/Hubble), while the radio image was taken from the VLA radio telescope (Image courtesy of NRAO/AUI).
Cassiopeia A is one of the “sample radio sources” often used by radio astronomers to calibrate instruments and to determine the diagram of the antenna. In fact, the procedure provides for the registration of the transit of a radio source with apparent diameter much smaller than the width of the main lobe of the antenna. This item is ideal to verify the performance of SPIDER230 and derive the amplitude of the lobe receiving our tool: in addition to being the brightest source sample is characterized by a straight line of the spectrum (in bi-logarithmic scale) over almost the entire the radio band, with a secular decrease in the flux density of the order of 1.1%/year. To get the value of the flux density in the CasA band from 20 MHz to 30 GHz using the expression:

where the value of the constant A is obtained taking into account that S(1 GHz) = 2723 Jy with spectral index n=-0.77 (period 1986). The following figure shows the calculations that were performed to obtain the spectrum of Cassiopeia A and the corresponding emission intensity at a frequency of 11.2 GHz, which is worth about 423 Jy (it is considered the secular variation of the flow).
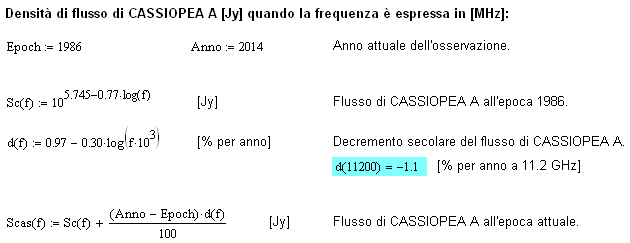
Calculation of the spectrum of Cassiopeia A (flow pattern as a function of frequency) in the radio band from 20 MHz to 30 GHz (data source: “The Absolute Spectrum of Cas A: An Accurate Flux Density Scale and a Set of Secondary Calibrators” JWMM Baars, R. Genzel, IIK Pauliny-Toth, A. Witzel-Astron. Astrophys. 61.99-106 (1977)).

Spectrum of the most intense “radio sources sample” used by radio astronomers to calibrate their instruments. The small angular size of these objects (usually no more than 4 minutes of arc) and the relatively intense flow make them very useful as sources of evidence in order to verify the performance of radio telescopes and antennas.
Using these data, we simulated the CasA transit registered with the SPIDER230 radiotelescope. The estimates are theoretical and consider an ideal behavior of the receiving system. The brightness temperature of the radio source, of the order of 210 K, produces an increase in the temperature of the antenna equal to about 0.68 K, very “diluted” because of the difference between the apparent size and the width of the lobe of receiving radio telescope.
The calculations show that the power variation “view” at the RAL10PL receiver input is of the order of 0.1 dBm -52.7 dBm with a value corresponding to the point of maximum intensity during transit. Registration simulated also shows the drift of the radiometric base line to facilitate comparison with the experimental data shown subsequently.
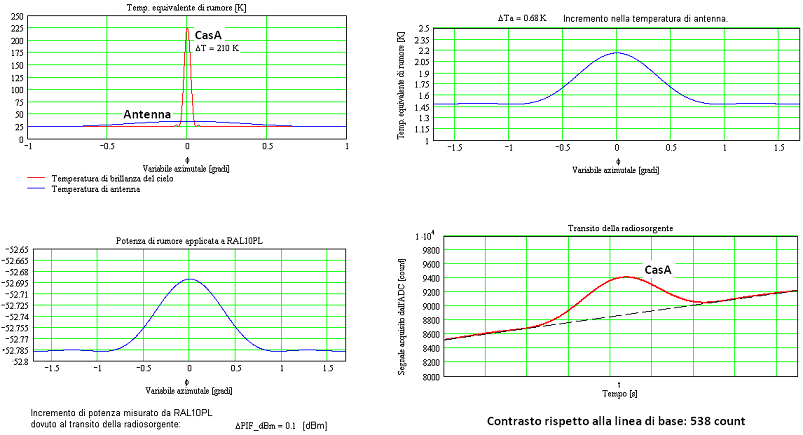
Recording simulated transit of radio source Cassiopeia A (3C461) in front of the antenna of the SPIDER230 radio telescope.
The verification of the theoretical evaluations was performed by Filippo Bradaschia, CEO of PrimaLuceLab, RadioAstroLab business partners in the implementation of the radio telescope SPIDER230 that we thank for cooperation. The receiving station installed at the Polo Tecnologico di Pordenone includes the RAL10PL 11.2 GHz receiver Total-Power made by RadioAstroLab for SPIDER230 and the antenna system (circular parabolic reflector 2.3 meters in diameter) with equatorial mount, motor and dome protection made by PrimaluceLab. The instrument is fully controllable through an Ethernet line, by software RadioUniverse.
Taking advantage of a day of ” dry air ” were organized observations to record the transit of Cassiopeia A. By using an equatorial mount , the antenna of the radio telescope SPIDER230 is very precise but, being small apparent size of the radio source , find the object can be difficult. To facilitate this task has been exploited SPIDER230 an interesting feature: the ability to shoot radio-images of a specific area of the sky using the RadioUniverse database software.
By orienting the antenna of the radio telescope toward the region of the sky where there is Cassiopeia A there were two consecutive images at low resolution, with a size of 10 x 10 pixels resolution radio and 0.5° in order to frame an area of sky wide 5 x 5° within which one could be reasonably sure of finding the radio source. The amplification factor of the receiver RAL10PL was set to the maximum value.

The SPIDER230 radio telescope used to record the transit of Cassiopeia A.
The two images obtained show the gradient of the signal caused by the contrast between the background of the sky (pixels of blue color) and the flux emitted from the ground and from the atmosphere near the horizon (pixels of red color). The angle at the lower right represents the closest point on the horizon. The presence of the CasA seems to be confirmed by the weak increase in brightness of the pixels shown in the following with respect to the boundary.
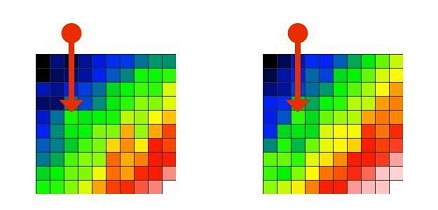 Images radio consecutive recorded by SPIDER230 in the area of sky of Cassiopeia A.
These measures have served to align the region in the radio map where you assumed the presence of the radio source, so as to require the software RadioUniverse automatically record 5 consecutive transits of the CasA, large 8 degrees. In all the recordings it was observed a signal peak, with sufficient contrast, exactly at the point occupied by the radio source. You are then exported the data for further processing with a spreadsheet.
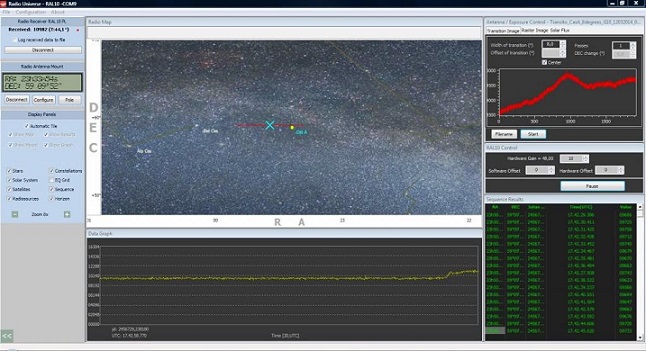
Check the transit of Cassiopeia A with the software RadioUniverse.
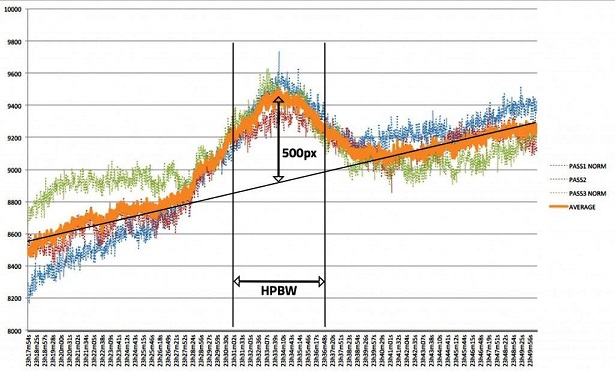
Transits of the radio source Cassiopeia A.
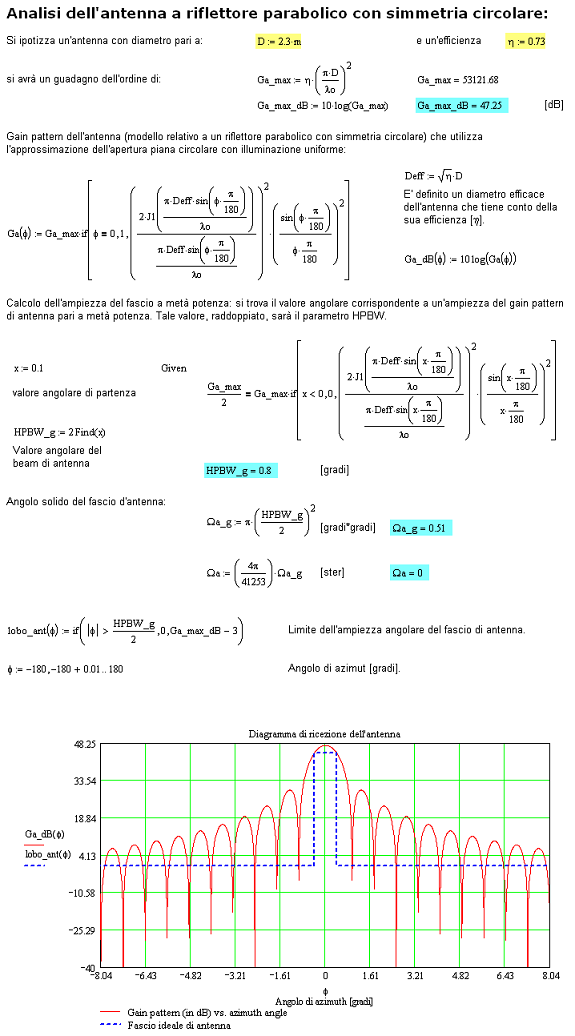
A simplified model of the diagram of the receive antenna of the SPIDER230 (parabolic reflector with circular symmetry and a diameter of 2.3 m) was approximated as a uniformly illuminated circular aperture and is given only the azimuthal variation.
As previously noted, Cassiopeia A (object “almost punctiform”) is often used as radiosource sample to verify the characteristics of the diagram of the receiving radio telescope, characterized by a lobe receiving much broader. In particular interesting obtain the HPBW parameter (Half Power Beam Width) which represents the amplitude at half power of the main lobe of the antenna (expressed in degrees). It uses the following formula:
![]()
![]()
in agreement with the value HPBW=0.8° obtained from the model of the antenna of SPIDER230 used in the simulations.
Here Is available to download the PDF of the complete article.
Experiments with RAL10KIT
We show with pleasure some recordings made by Mr. Giancarlo Madiai, amateur enrolled in the IRAS (Spezzino Astronomical Research Institute – http://www.astronomiadigitale.com/iras/) who we thank for his availability. Giancarlo, a very active investigator and an enthusiast of all that shines in the sky, has used a RAL10KIT as a receiver for implementing two instruments operating at different frequencies.
GThe experiments described, far from being definitive and exhaustive (they are a starting point to start an interesting observation of the sky with radio techniques, as an alternative the optical one, well established for amateur astronomers…), are interesting because illustrate some of the possible “roads” practicable by an amateur radio astronomer. Of course this is just the beginning … the work continues …
The first is a radio telescope operating at a frequency of 11.2 GHz, composed of a standard LNB for receiving TV-SAT in Ku-band and an parabolic reflector antenna offset of 120 centimeters in diameter. There follows a coaxial cable for TV-SAT of 75 Ω which carries the signal to RAL10KIT receiver.
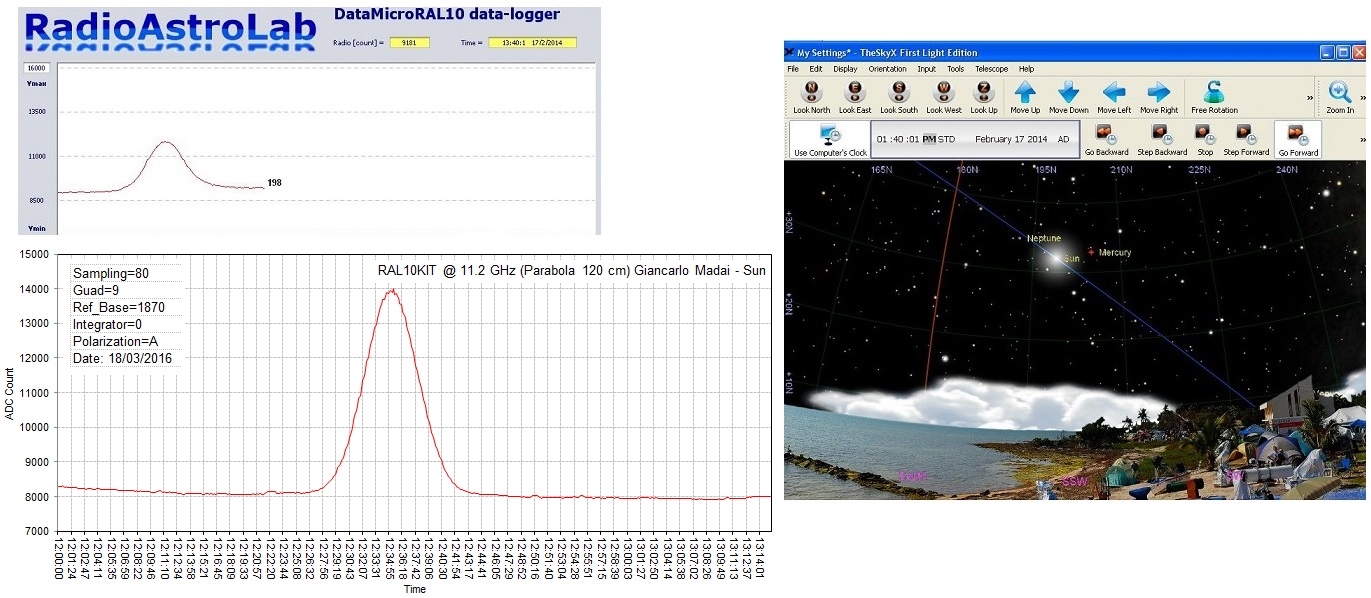
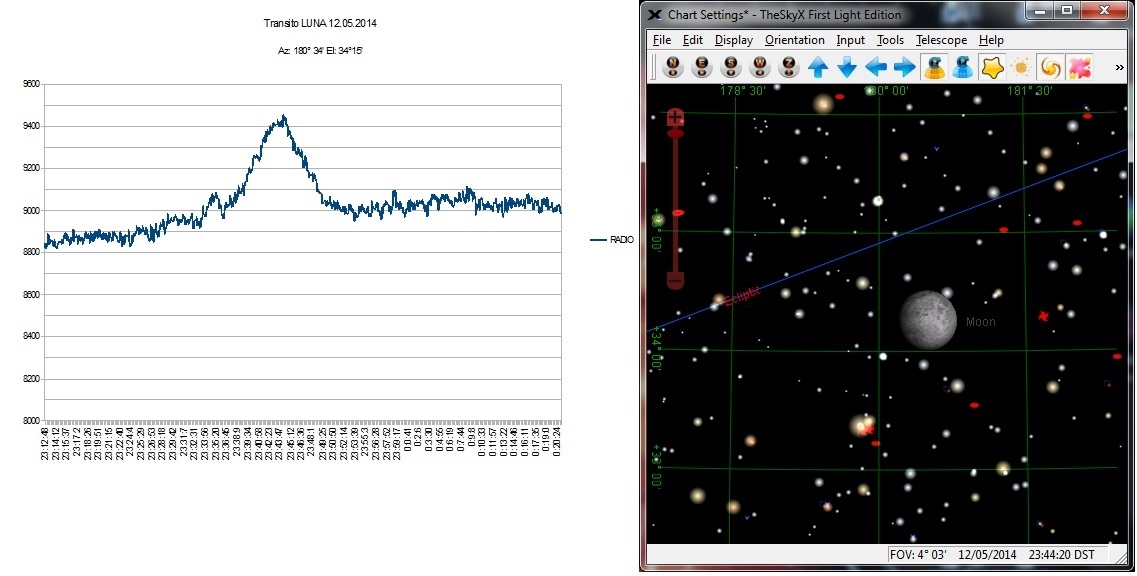
The previous images show some transit of the Sun and the Moon recorded with this instrument.
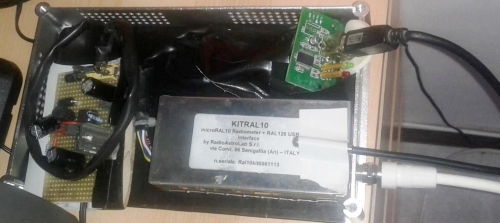
Experimental receiver based on RAL10KIT realized by Giancarlo Madiai and used for his radio astronomy experiments. On the left we see the power supply constructed by the author on a “breadboard” printed circuit for prototypes, at the top you see the USB interface for the connection of the radiometer to the station computer and a temperature sensor (fixed on the cover of the metal container of RAL10KIT) to check the thermal drift of the radiometer.
The second radio telescope operates at 1420 MHz: the external drives, arranged on the roof of the Loop-Yagi antenna (gain of about 20 dB, amplitude of receiving lobe of 16 degrees) and a commercial LNA (frequency input band 1350-1500 MHz, about 22 dB gain and 0.7 dB of noise figure), there follows a coaxial cable that carries the signal within a standard line amplifier for satellite TV (typical band input 900 -2000 MHz with a gain of about 20 dB) followed by RAL10KIT receiver.
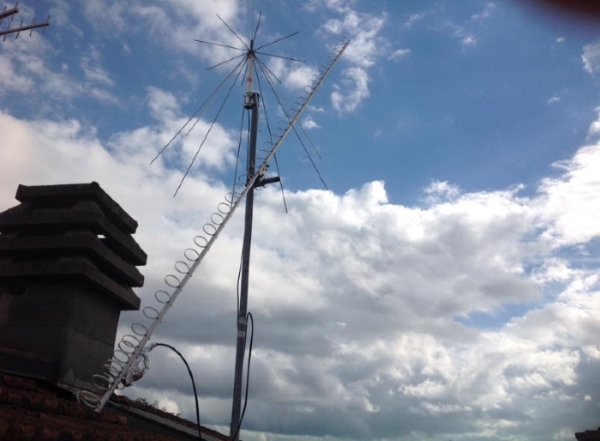
Yagi-Loop Antenna at 1420 MHz (it is the almost vertical antenna directed toward the sky, composed of many “rings” aligned, supported by an aluminum shaft). At the base of the antenna, where the coaxial cable that carries the signal to the receiver exits, you can notice the low-noise pre-amplifier (LNA), which “strengthens” the RF signal before the long cable descent.
Giancarlo has also used a two-way power divider (Power Splitter 900-2600 MHz), before the RAL10KIT, so as to send the received signal also to a RTL-SDR receiver on USB stick: in this way you can simultaneously observe (and record) the radiometric signal (so the measurement of the average power in band associated with the received signal) with RAL10KIT and perform spectral analysis (with spectrograms) with SDR receiver and the supplied software.
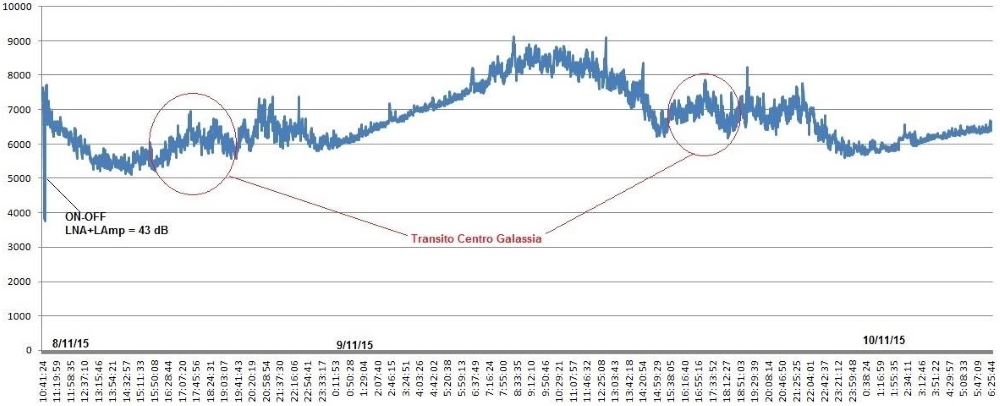
Receiving test, with the radio telescope to 1420 MHz, of the center of the galaxy (Sagittarius A): the reception looks very disturbed, there are clear positive signal “night” drifts, consistent with the decrease of the outside temperature (excursion especially experienced by the external LNA unit), and less “noisy” due to the reduction of the “industrial” interference. The antenna is oriented to the meridian, with elevation of 28 degrees.
Of course, repeated tests will be necessary to confirm and highlight with certainty the transit of Sagittarius A, especially when the electromagnetic environment of the observation site is particularly disturbed.
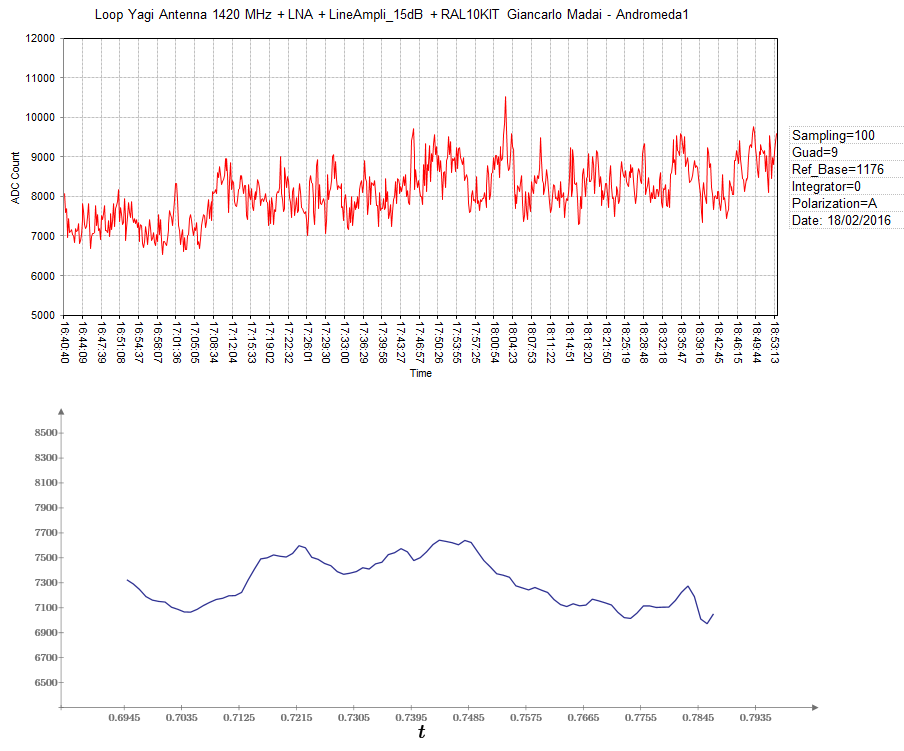
This is a reception test, carried out with the radio telescope at 1420 MHz, with the antenna oriented in the direction of the Andromeda Galaxy (M31-NGC224), a giant spiral galaxy that is part of the Local Group. The second graph shows the evolution of the average value of the signal.
Actually this subject seems too weak to be detected, with certainty, by the instrument.

